EXPERIMENTAL DATA: Forces, Moments, Pressures
1st
AIAA CFD High Lift Prediction Workshop
Some relevant force, moment, and pressure experimental data from the NASA Langley 14x22-foot wind tunnel test are given
here.
Corrected "Standard" Data for Config 1 (Slat 30,
Flap 25):
- Used for HiLiftPW-1
- Corrected for use with free-air conditions
- Conducted in tunnel using pitch-pause method (8 sec of data taken at each alpha), alpha increasing
- Forces and Moments (Test 513 Run 105: considered a clean model configuration;
i.e., no hot film leads, no PIV taped areas)
- CP Data (gzipped tar file)
- Estimates of Experimental Bounds (based on 3 test campaigns; gzipped tar file)
Corrected "Standard" Data for Config 8 (Slat 30,
Flap 20):
- Used for HiLiftPW-1
- Corrected for use with free-air conditions
- Conducted in tunnel using pitch-pause method (8 sec of data taken at each alpha), alpha increasing
- Forces and Moments (Test 478 Run 63)
- CP Data (gzipped tar file)
- Estimates of Experimental Bounds (based on a single test campaign; gzipped tar file)
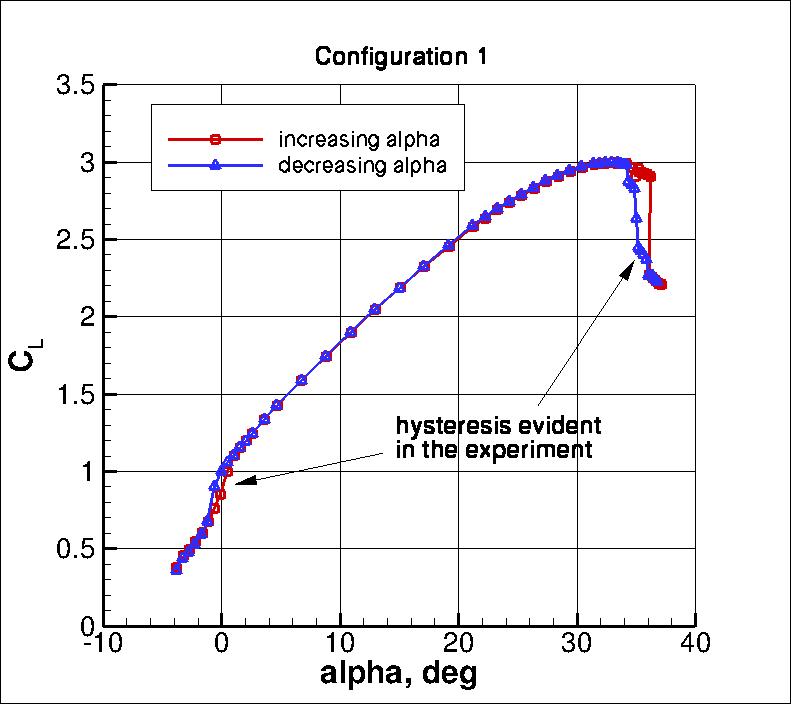
Corrected "Hysteresis" Data for Config 1 (Slat 30,
Flap 25):
- Corrected for use with free-air conditions
- Conducted in tunnel using pitch-pause method (8 sec of data taken at each alpha), alpha decreasing
- Forces and Moments (Test 513 Run 106)
- CP Data (gzipped tar file)
Uncorrected "Standard" Data for Config 1 (Slat 30,
Flap 25):
- For use when computing with wind tunnel walls
- Conducted in tunnel using pitch-pause method (8 sec of data taken at each alpha), alpha increasing
- Forces and Moments (Test 513 Run 105)
- CP Data (gzipped tar file)
Uncorrected "Hysteresis" Data for Config 1 (Slat 30,
Flap 25):
- For use when computing with wind tunnel walls
- Conducted in tunnel using pitch-pause method (8 sec of data taken at each alpha), alpha decreasing
- Forces and Moments (Test 513 Run 106)
- CP Data (gzipped tar file)
Same information in Table format:
* indicates gzipped tar file
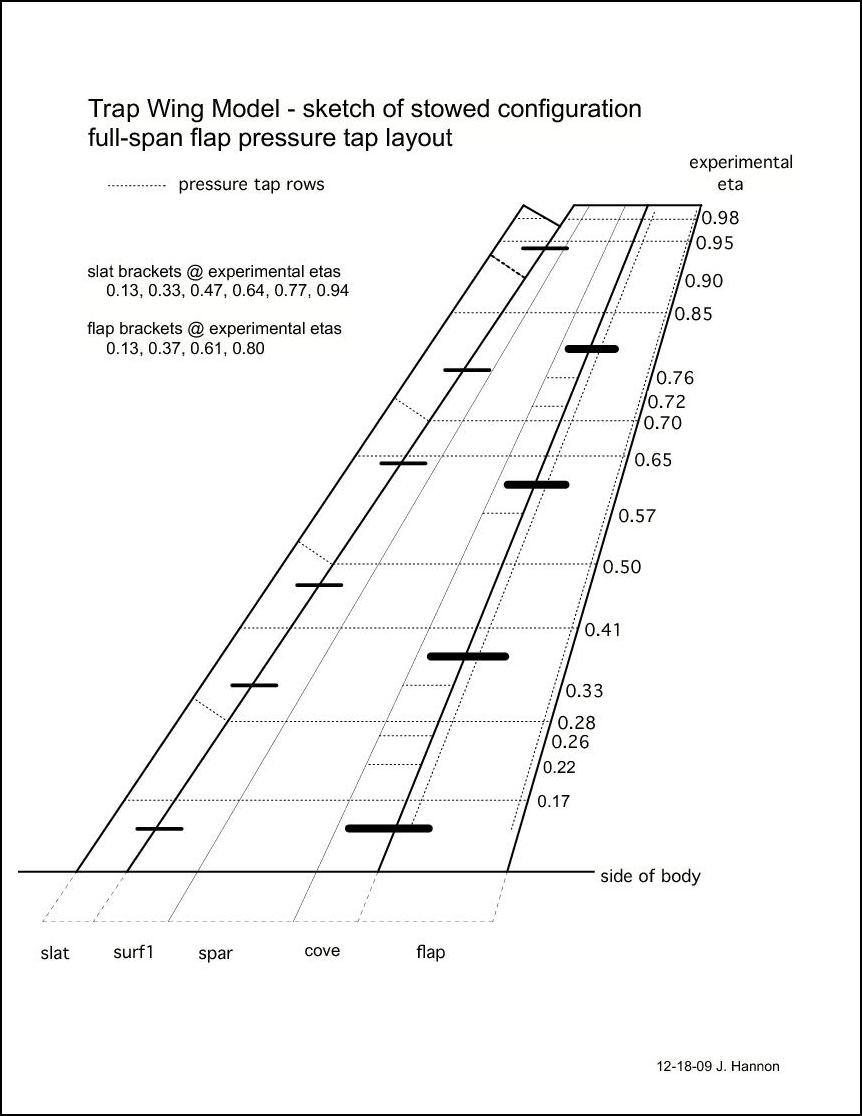
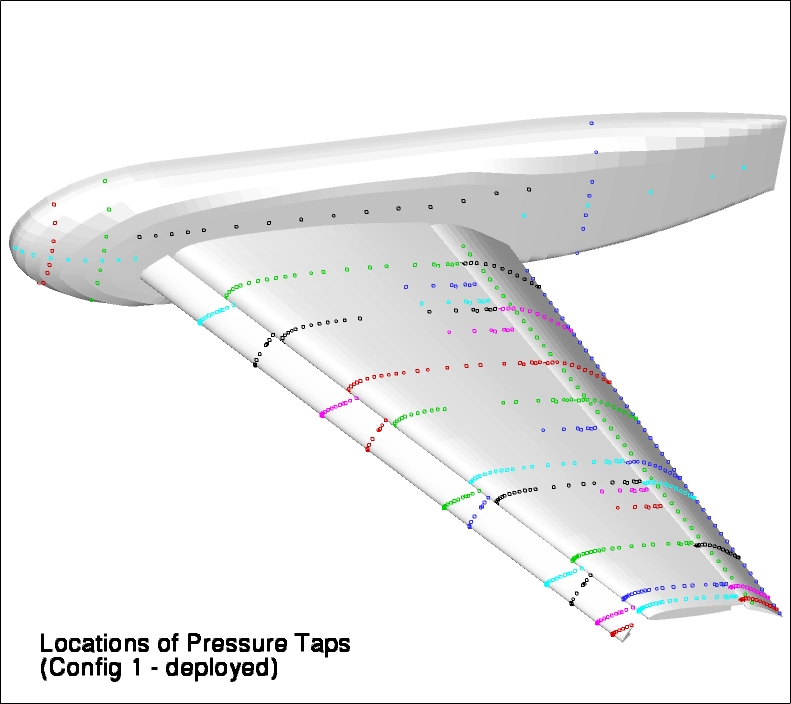
Some relevant figures are provided below:
The above eta values are used as part of reference
names in many of the trap wing files.
Note, however, that these listed eta locations were for the original
experimental geometry (not given or used in this Workshop).
As discussed on the
Geometries Page,
the original geometry was shifted 0.95 inches
in y to align the base of the metric standoff to the computational
symmetry plane used for CFD. As a result,
the exact same eta values would not be recovered
using the given "CFD geometry" locations.
See the files
extraction.planes.deployed-config1.txt
and
extraction.planes.deployed-config8.txt
for locations of Cp extraction planes in terms of the given
deployed geometries.
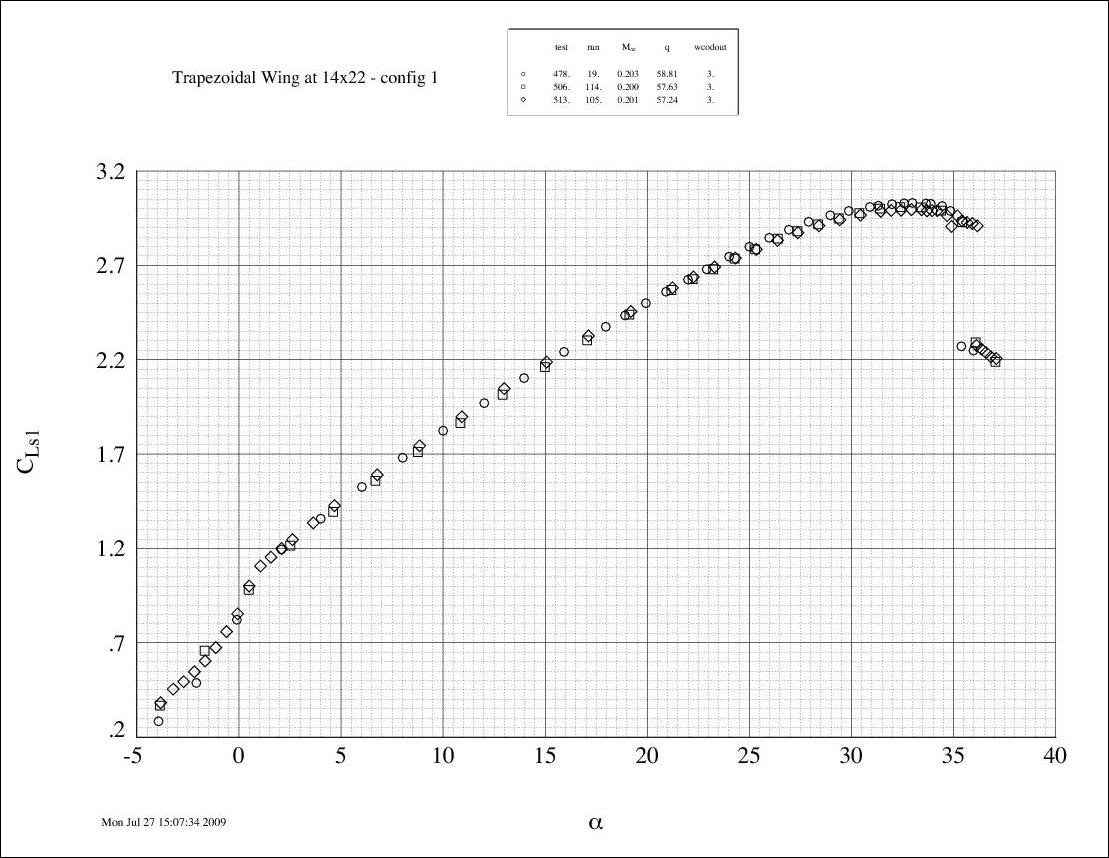
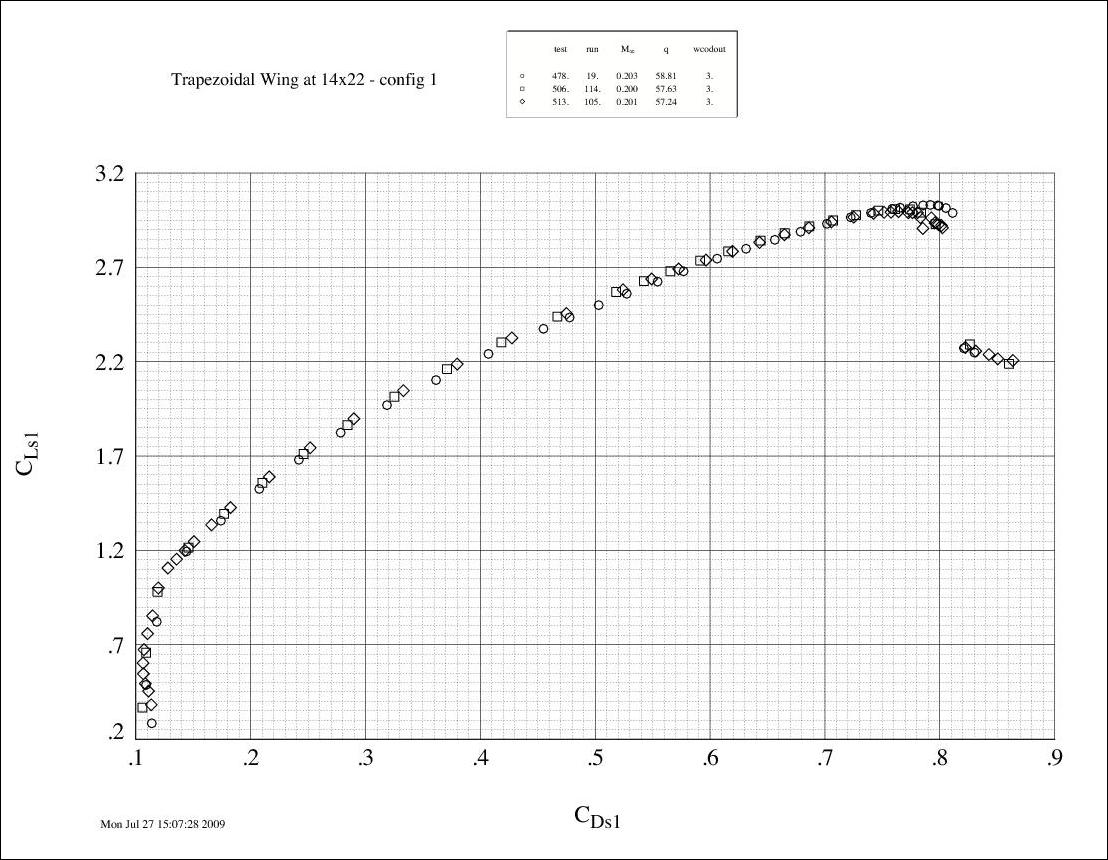
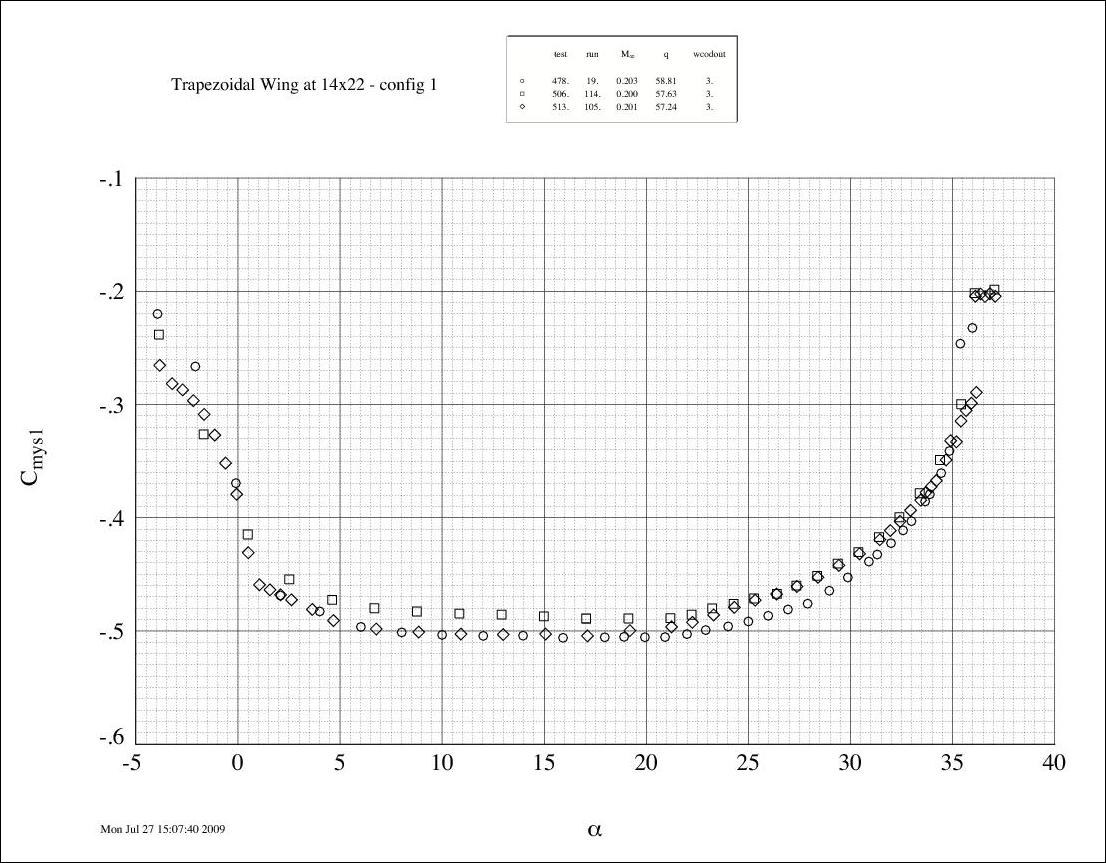
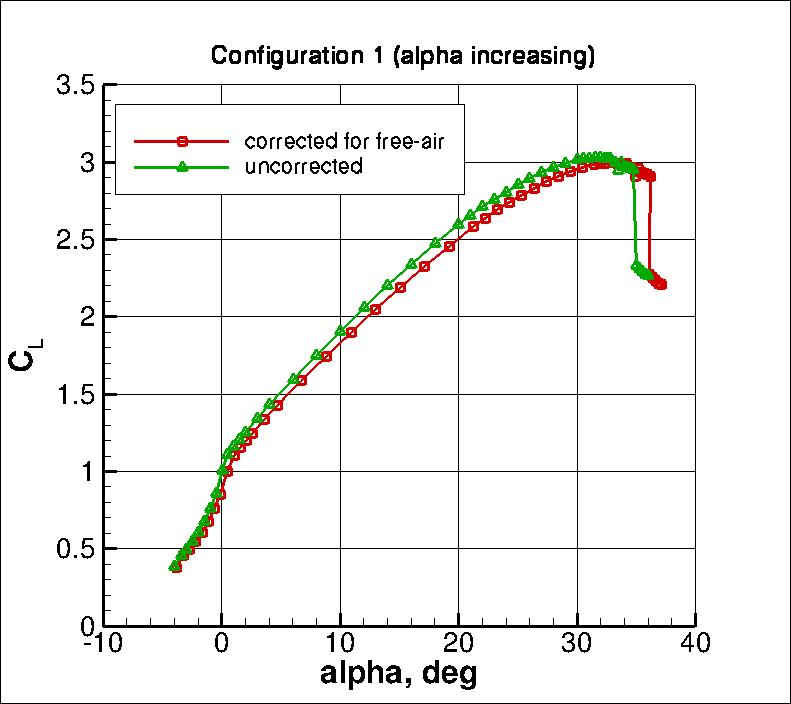
Config 1 Forces and Moments
Note 1: Subscripts "s" and "1" are internal designations; "s" refers
to stability axis, "1" refers to balance number 1.
Term "wcodout = 3" indicates that blockage and jet boundary wall corrections
have been applied to the data.
Note 2: The experimental data shown here were taken with angle-of-attack
increasing (stopping at each specified angle). At the stall angles
beyond alpha=34, there was hysteresis evident
when taking data with angle-of-attack decreasing (not shown).
Also, there was a region of hysteresis between alpha = -1 and +1 (not shown).
Note 3: The Reynolds number of Re=4.3 million asked for in the test
cases represents an approximate average of the Reynolds numbers in
the corresponding experiments (range from roughly
4.1 - 4.7 million).
Note 4: Moment coefficient is positive nose-up.
Return to: Experimental Data Top Page
Return to: High Lift Prediction Workshop Home Page
Page Curator and NASA Official Responsible for Content
Christopher Rumsey
Last Updated
September 16, 2011
Privacy Act Statement
Accessibility Statement
