skip to content

SLAT ATTACHMENT LINE LOCATIONS & DISCUSSION

1st AIAA CFD High Lift Prediction Workshop


Slat Attachment Line

The attachment line locations, Satt, were estimated based on the experimental pressure data following a method described by Bertelrud in AIAA 94-2152. The accuracy of the attachment line location is very dependent on the number of pressure ports. (To read more about the uncertainty in the estimation of the attachment line, click here. ) There were 10 rows of pressure ports on the slat. Six rows of taps were aligned in the streamwise direction at eta = 0.17, 0.41, 0.65, 0.85, 0.95, 0.98. Eta is the non-dimensionalized span wise coordinate and is equal to Y / 85.059 in. (the span of the model). There were also four rows of taps aligned normal to the leading edge of the slat at eta = [0.28, 0.50 ,0.70 ,0.90]. In general there were too few ports to accurately characterize the attachment line, but that is usually the case since it is difficult to fit many ports into the small slat. As the slat is rotated to higher angles of attack the attachment line becomes harder to find because of the wider spacing of the pressure ports as you approach the cusp of the slat. In general the estimation of the attachment line locations are only valid up to approximately AOA = 24 degrees. Past 24 degrees the attachment line moves between the last row of pressure taps and the cusp of the slat and it becomes difficult to predict it any further.
 

Streamwise pressure taps

The attachment line locations and the values of Rbar and K (relaminarization parameter) are estimated based on the measured pressures on the slat. At each eta the pressures are used to compute the component of the velocity normal to the leading edge by using the physical sweep angle of the model. The normal velocities computed from ports located to the left (negative s direction) of the point of maximum pressure are assigned a negative sign. The attachment line is then designated as the point where the normal velocity component is zero. This process is begun by assuming the sweep of the model is the sweep of the flow. The attachment line location is found and the value of Cp at that location is used to find a new value of the effective sweep angle angle. The process is repeated until the effective sweep angle converges.

The attachment line locations were computed for each eta versus angle of attack. As the angle of attack increases the attachment line moves from the positive s side of the wing to the negative s side. The computation of the attachment line was stopped once it became difficult to define a maximum value of Cp. In general this happened close to 24 degrees angle of attack.
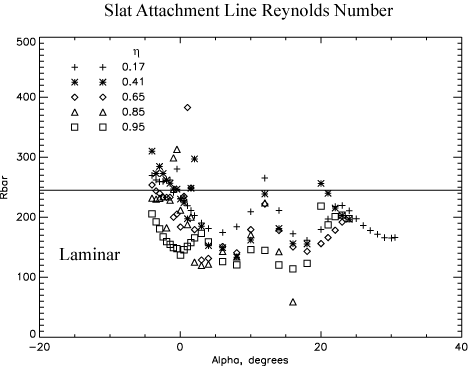
A plot of Rbar using the criteria of Gaster, Poll, Pfenniger, Hall shows that, with the exception of negative angles of attack, Rbar generally falls in the range where the attachment line would be considered laminar. At negative angles of attack, the values suggest that at some locations, if there is contamination, for example free stream disturbances, then the turbulence would be self sustaining and the attachment line could be transitional or turbulent. At Alpha = 12 degrees the values of Rbar are very close to the criteria for the flow to transition if disturbed. At 20 degrees the values at eta = 0.41 are also very close to the limit.

Attachment line location relative to films. The figure in this link shows the relative locations of the attachment lines and the hotfilms that are on the underside of the slat, but before the cusp. Since the model is swept, the leading edge location at each spanwise station was subtracted from the x locations so that the leading edge of the model is represented by the gray line in the figure. The films depicted are, from bottom to top, objects 34, 38, and 39.

Location of the attachment line in x, z nested coordinates, along with Rbar values and effective sweep angle for 12, 16, and 24 degrees.
 

Normal pressure taps

None of the normal rows of pressure taps had enough ports to adequately compute the attachment line location.    If you click here  you will see that there were insufficient pressure taps in the normal direction to give a reasonable output, especially at eta = 0.50 and eta = 0.70.   Therefore the normal ports were not used for the determination of the attachment line location or state.


Return to: Slat Notes Top Page

Return to: Transition Notes Top Page

Return to: Transition Information Top Page

Return to: Experimental Data Top Page

Return to: High Lift Prediction Workshop Home Page


Page Curator and NASA Official Responsible for Content
Li Wang  

Last Updated
August 15, 2011

Privacy Act Statement

Accessibility Statement