
EXPERIMENTAL DATA: Forces, Moments, Pressure Coefficients
2nd
AIAA CFD High Lift Prediction Workshop
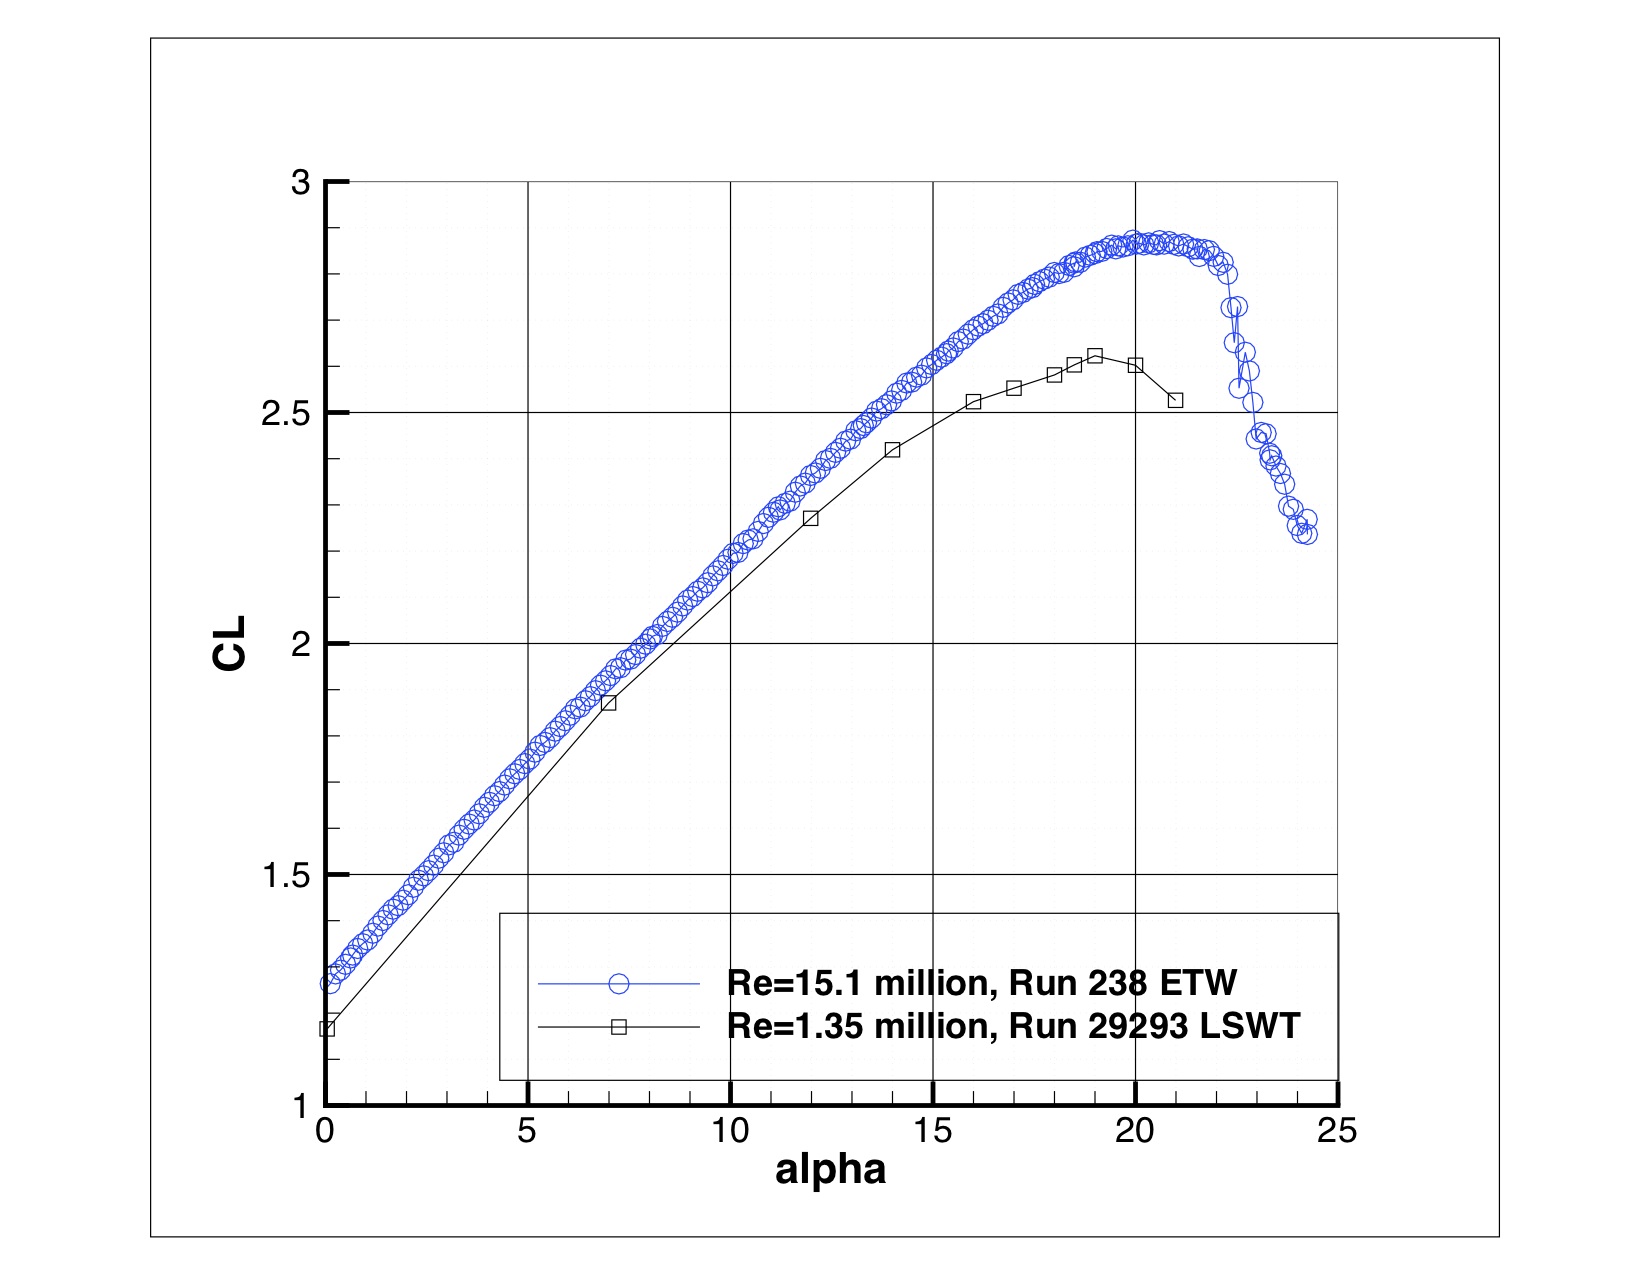
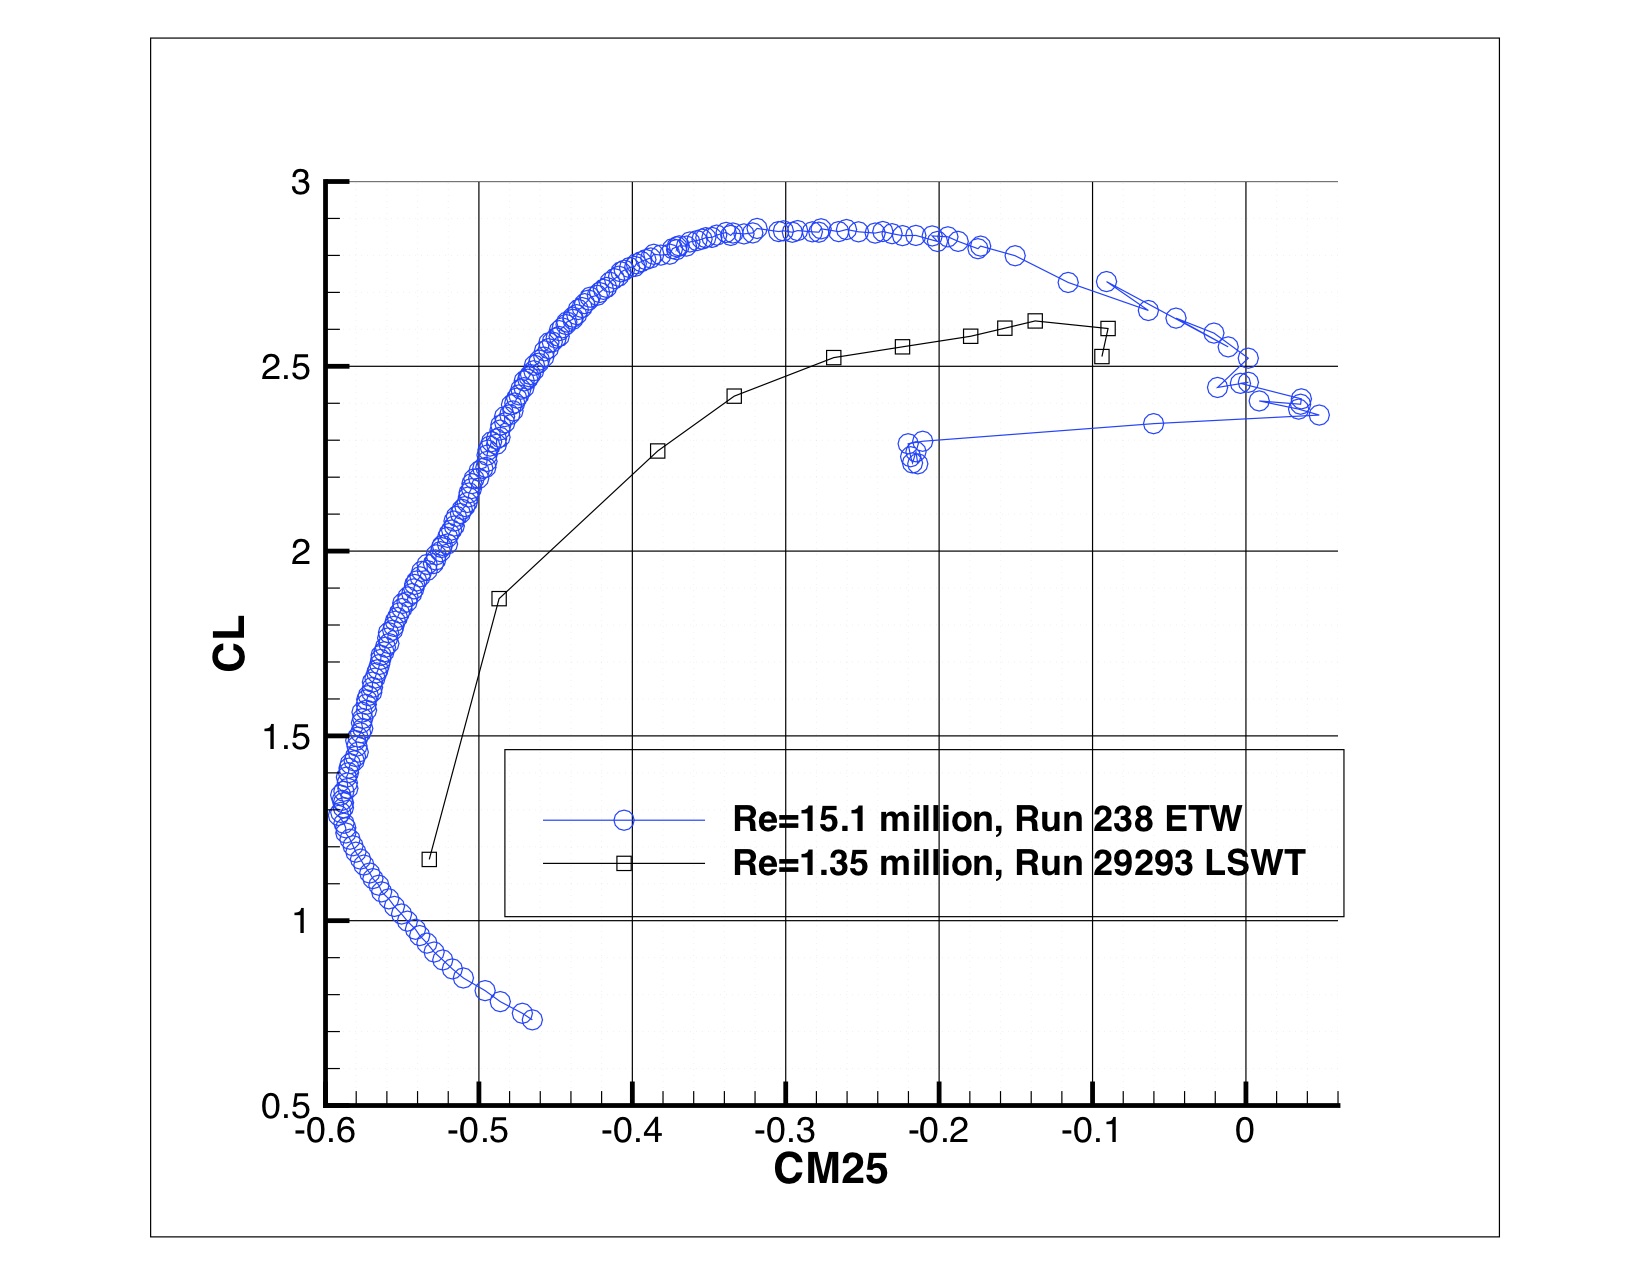
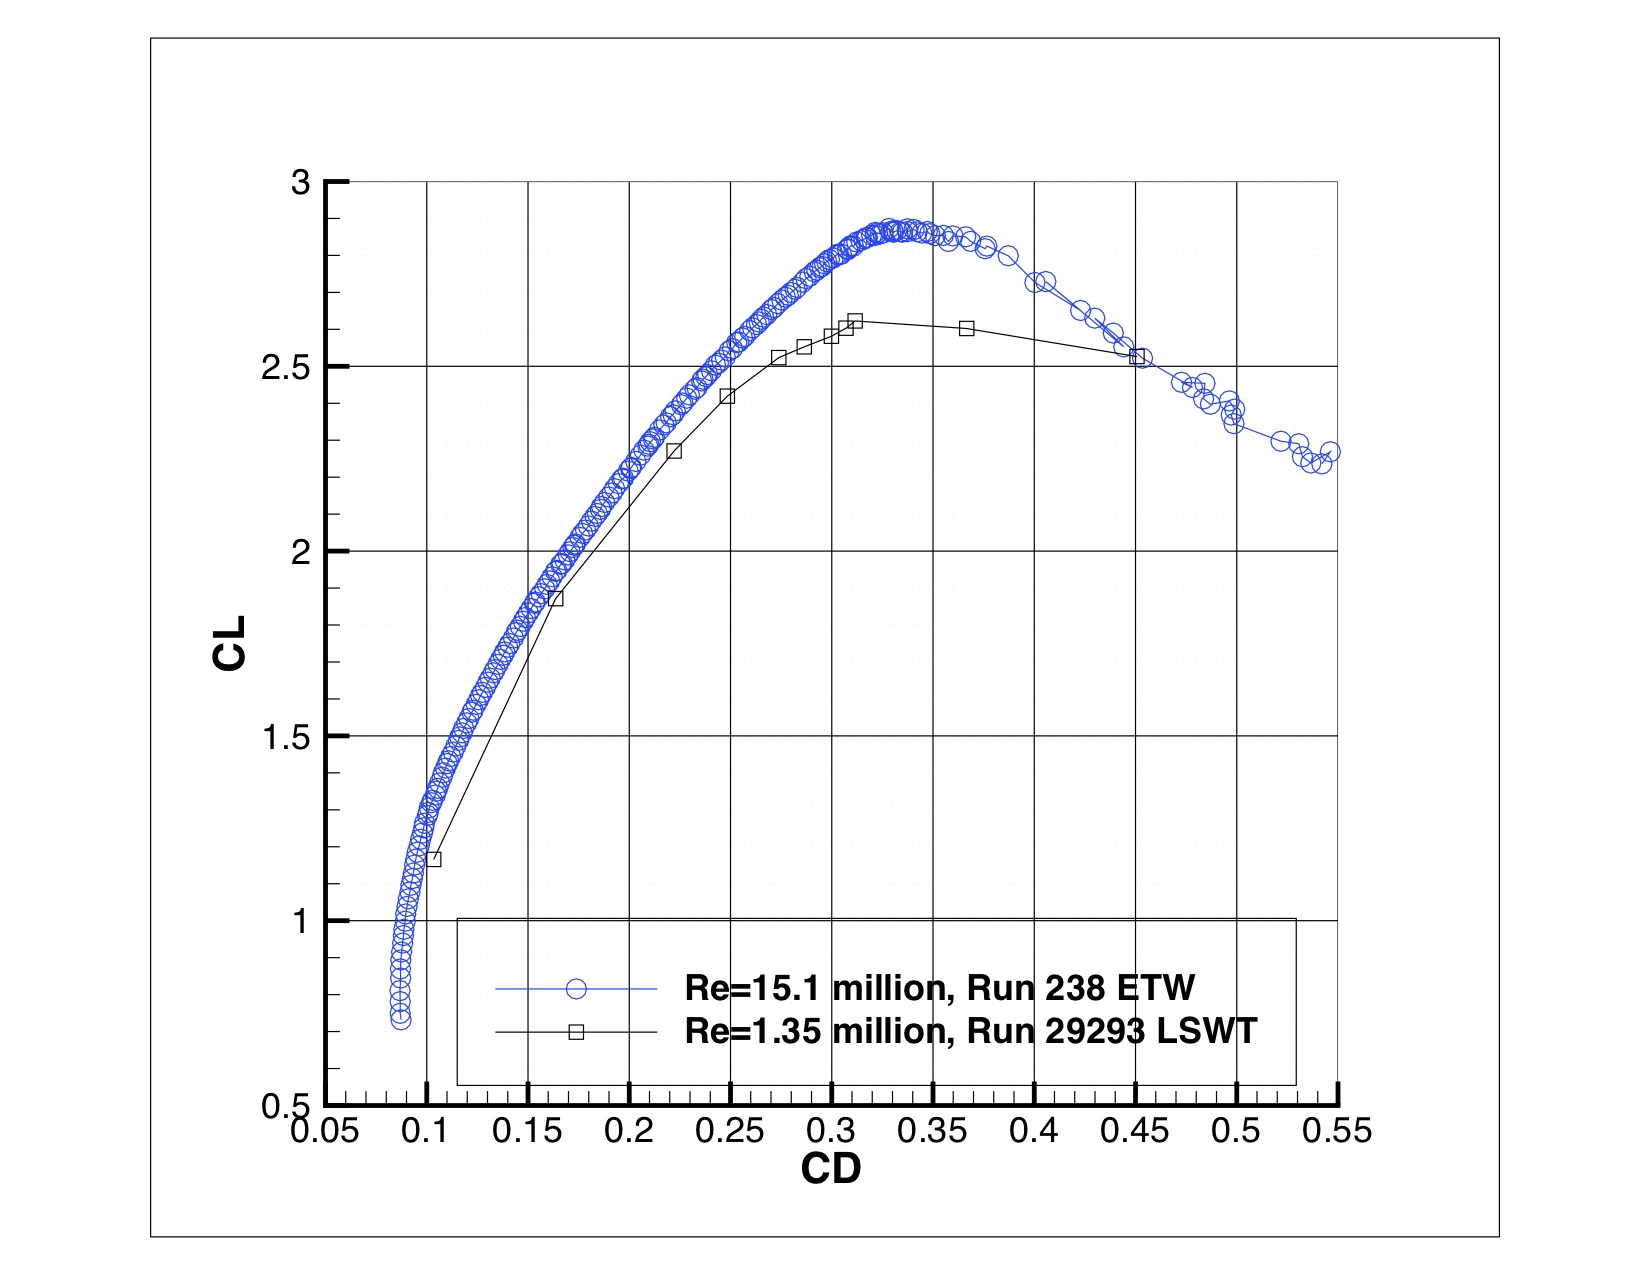
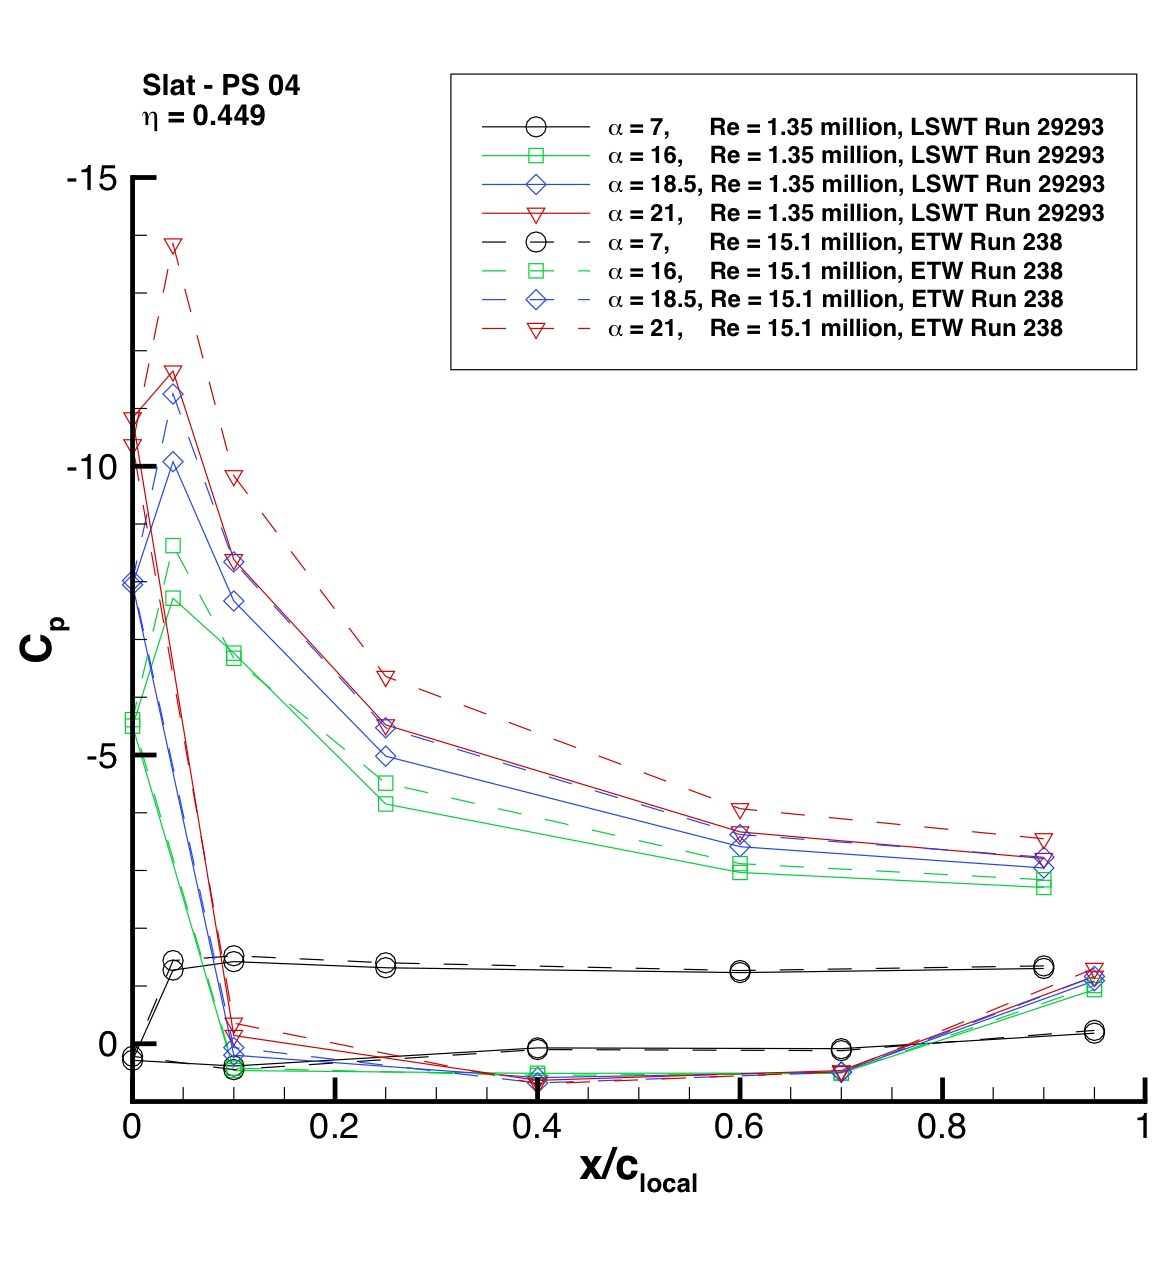
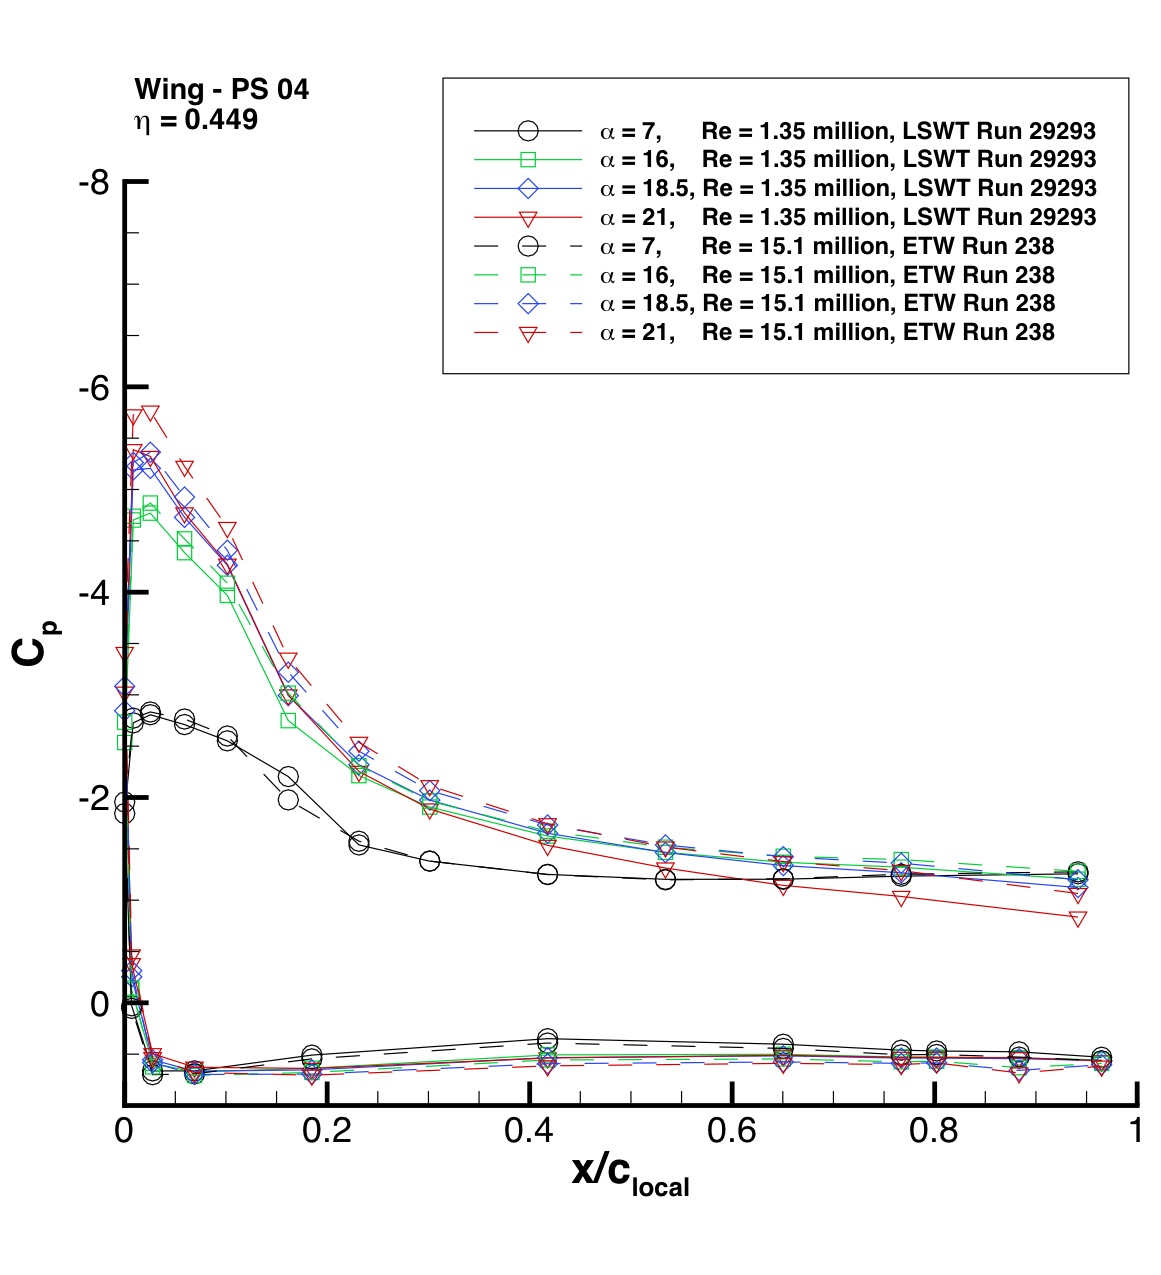
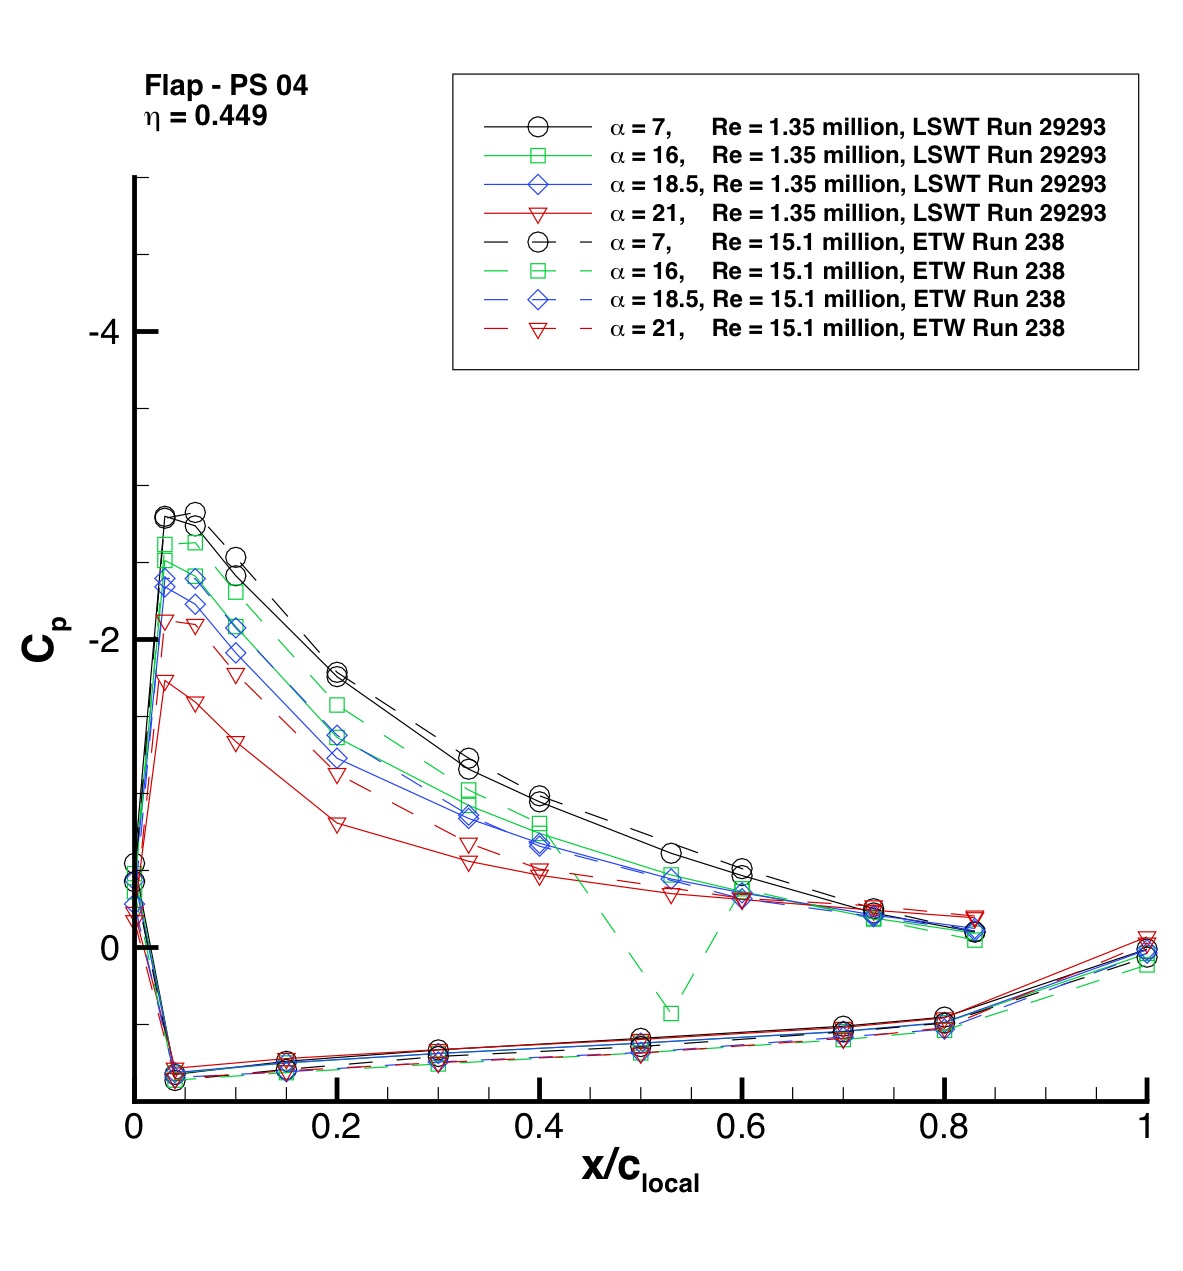
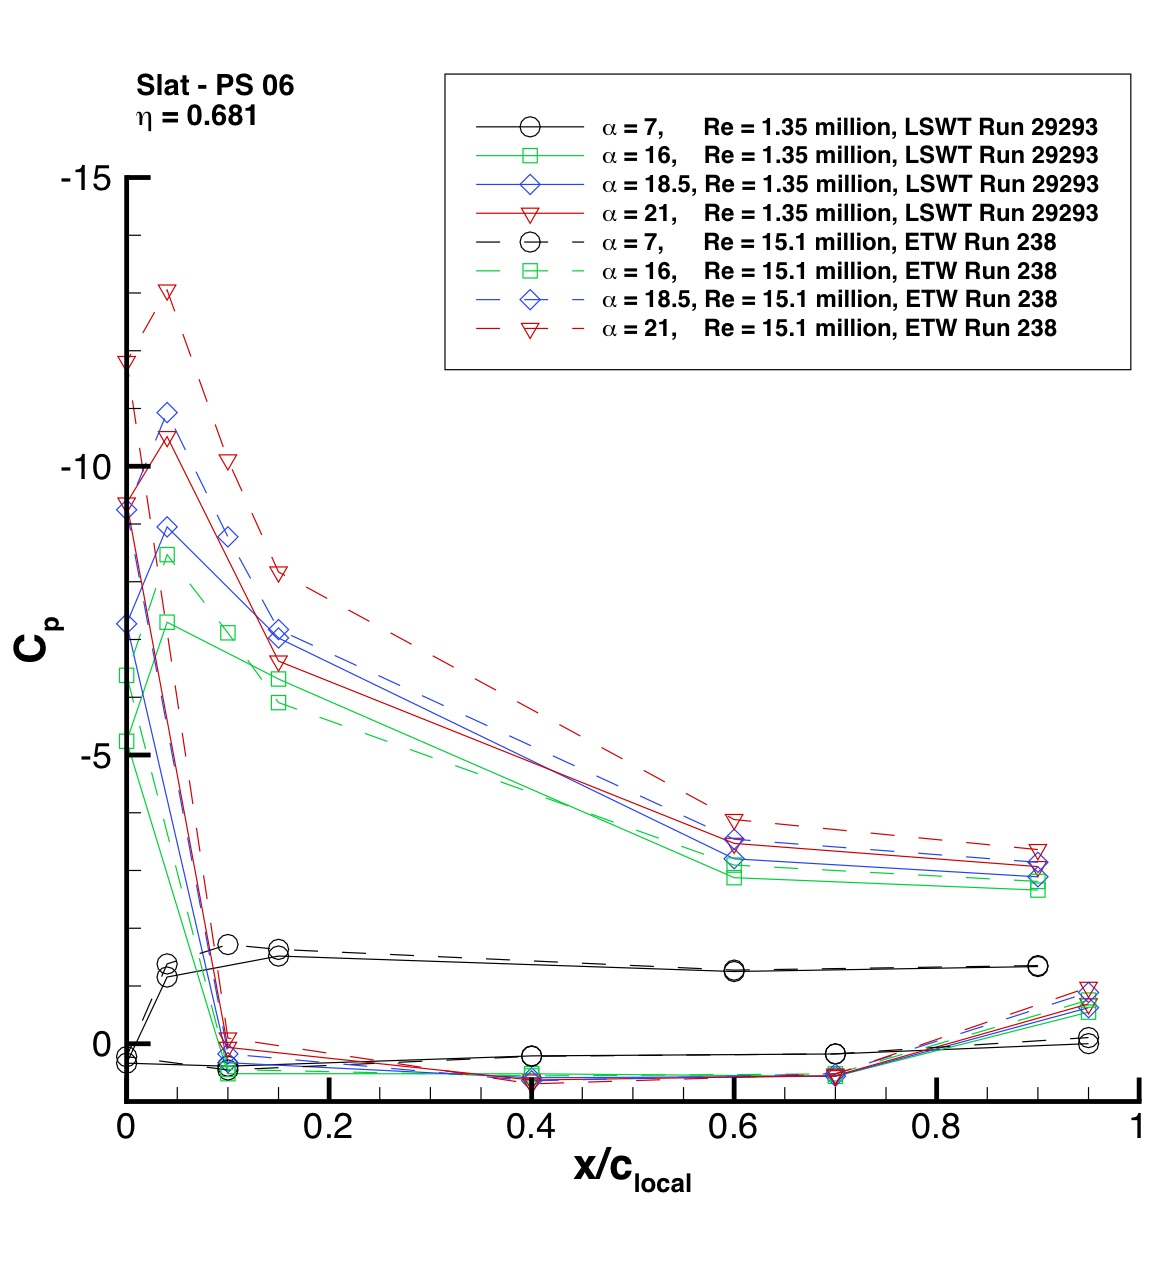
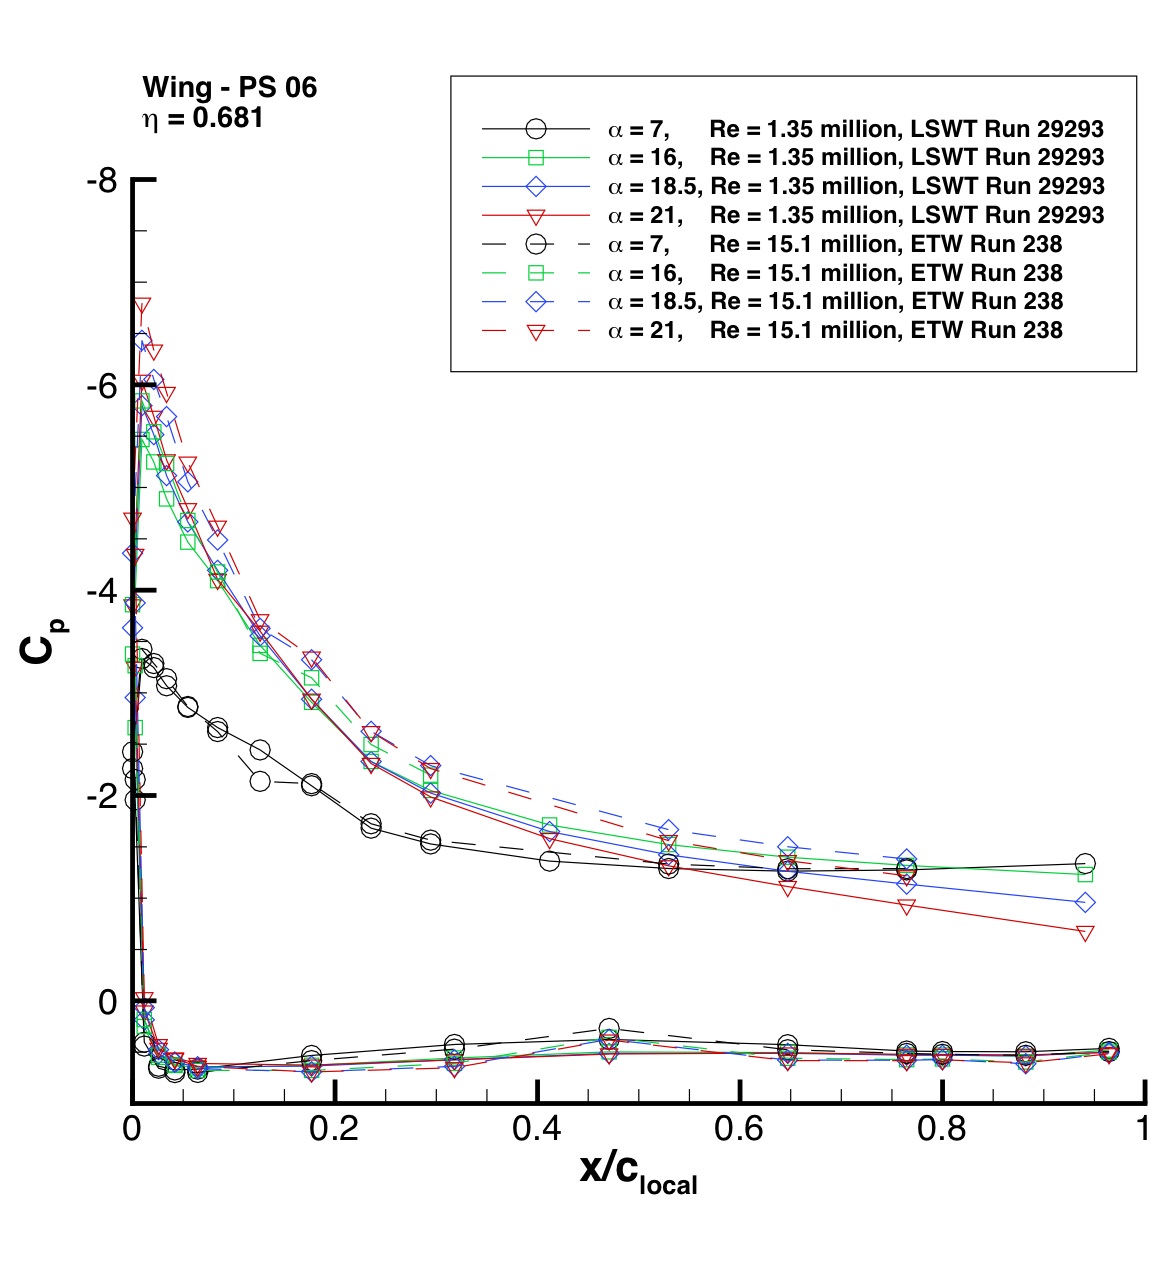
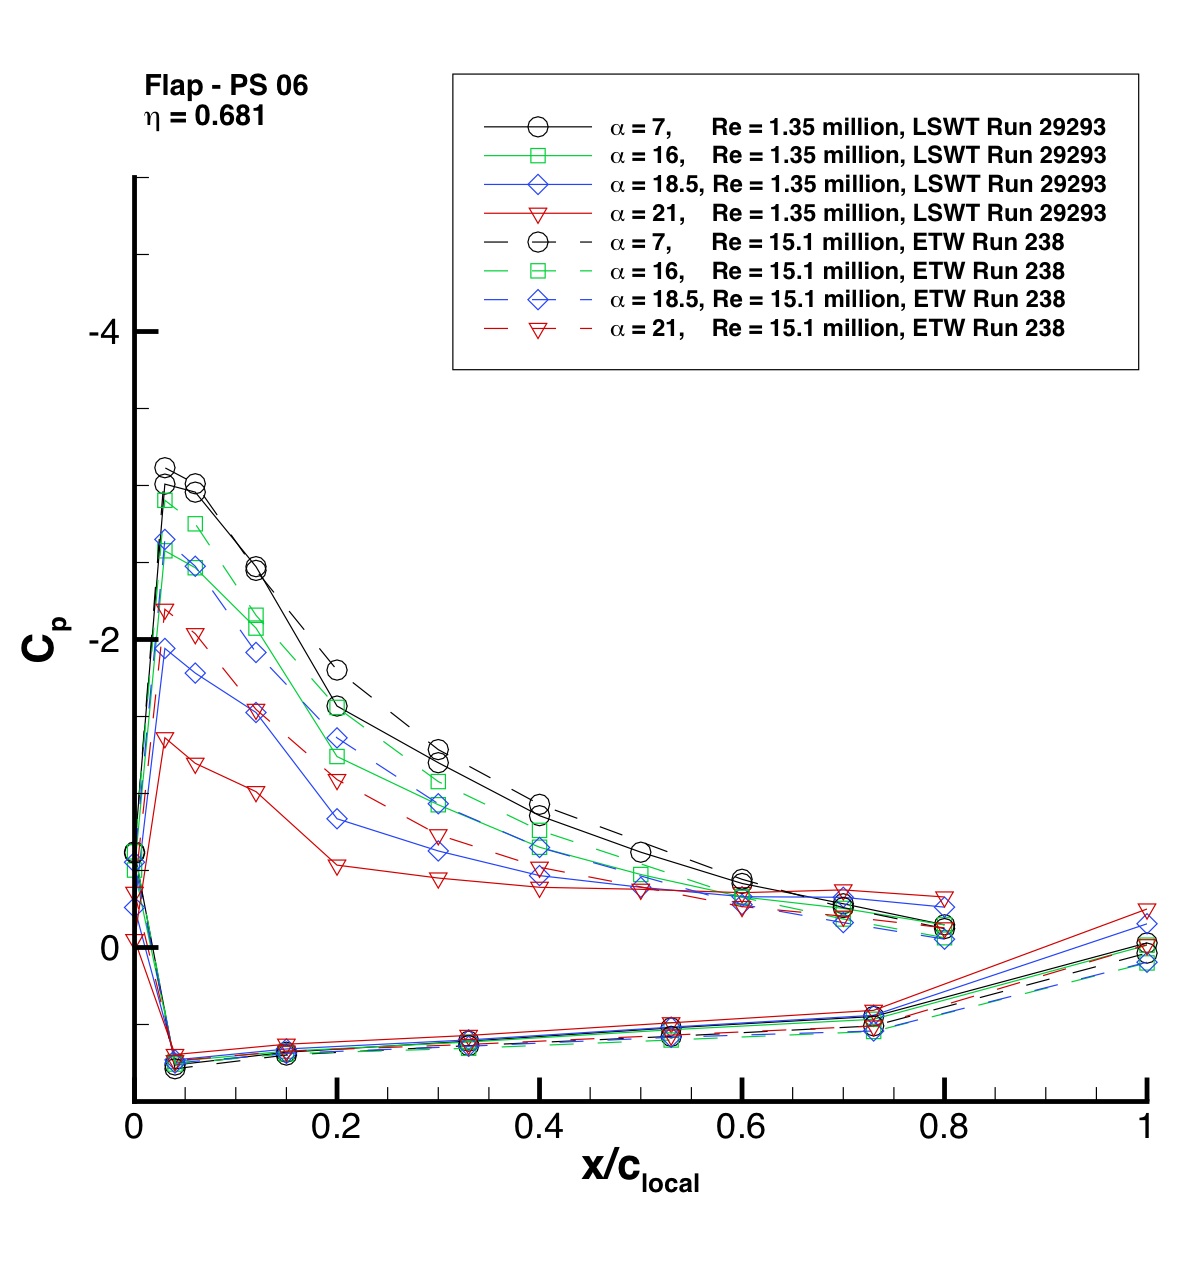
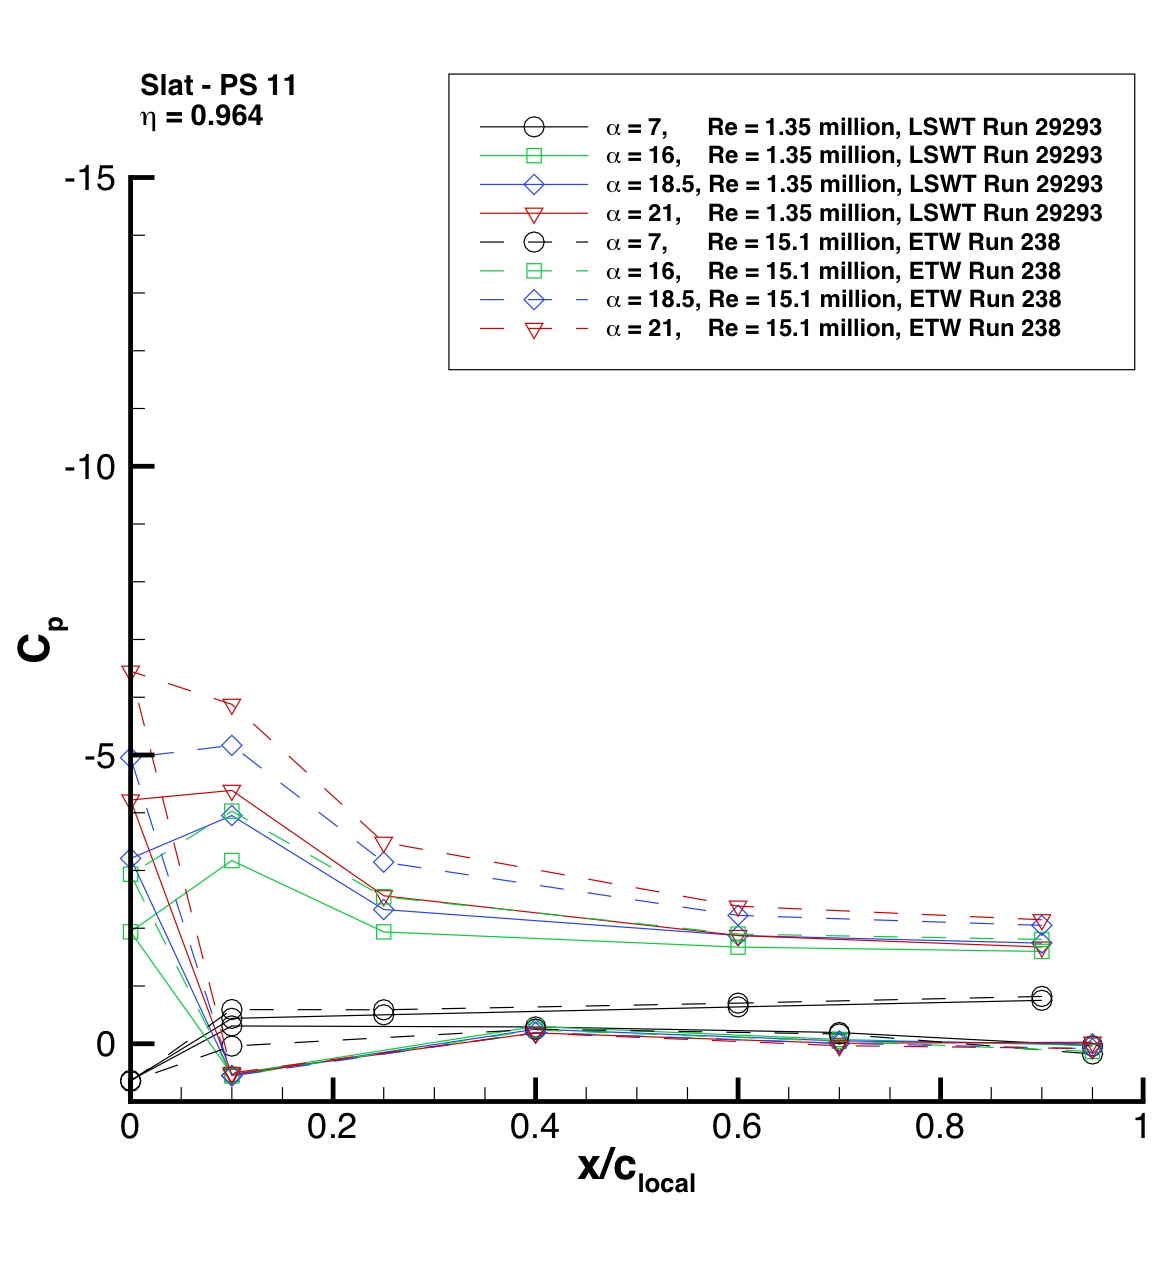
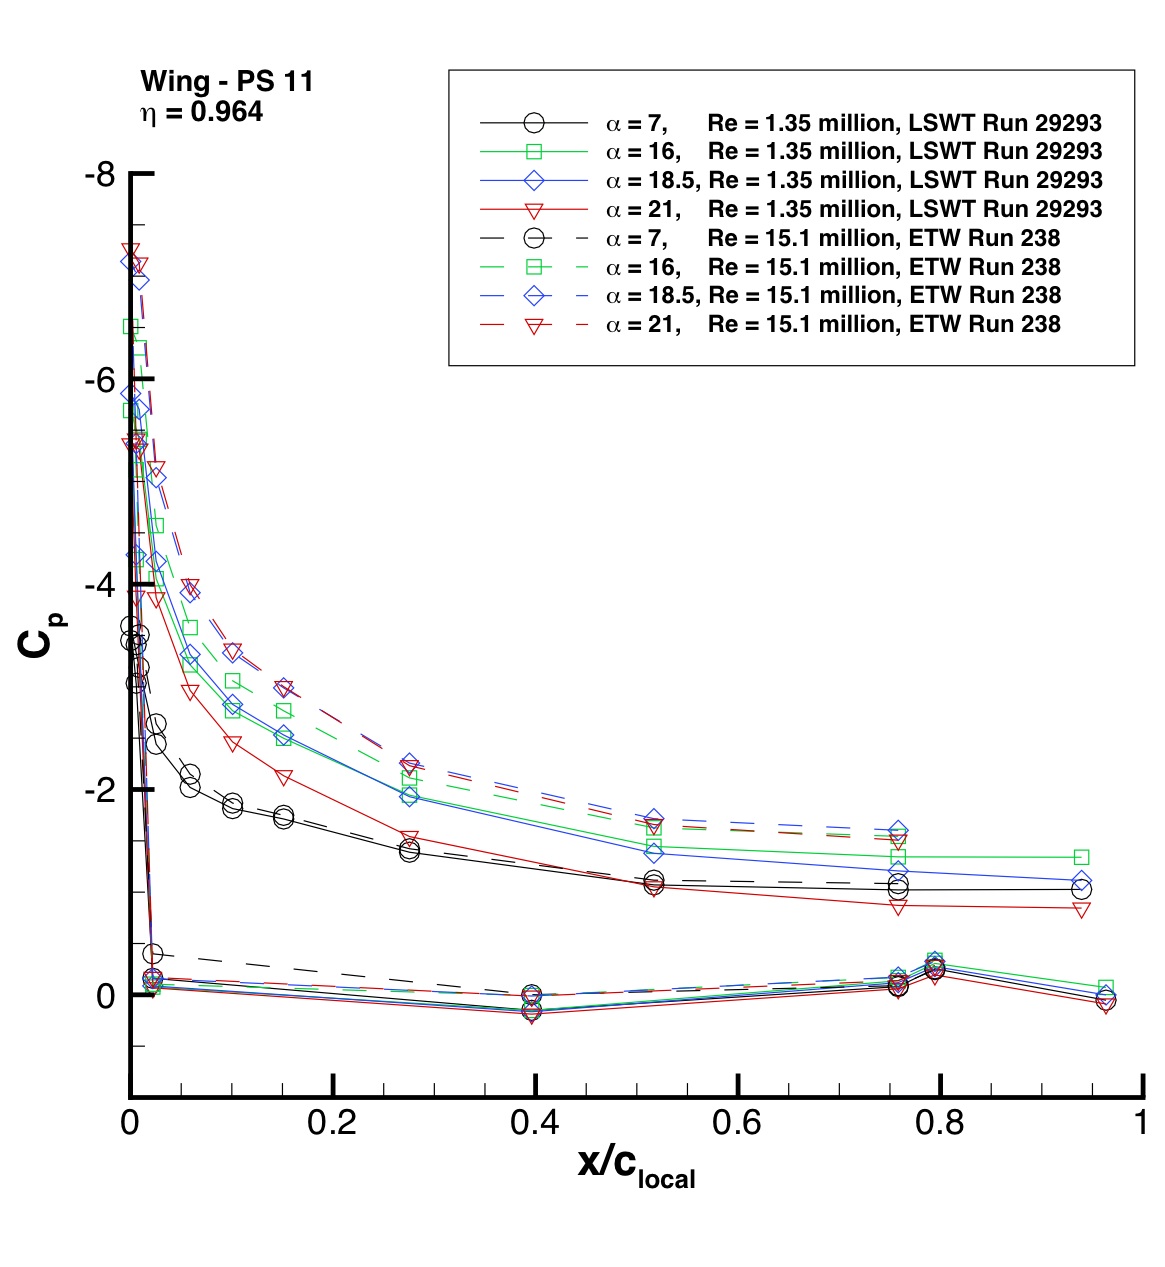
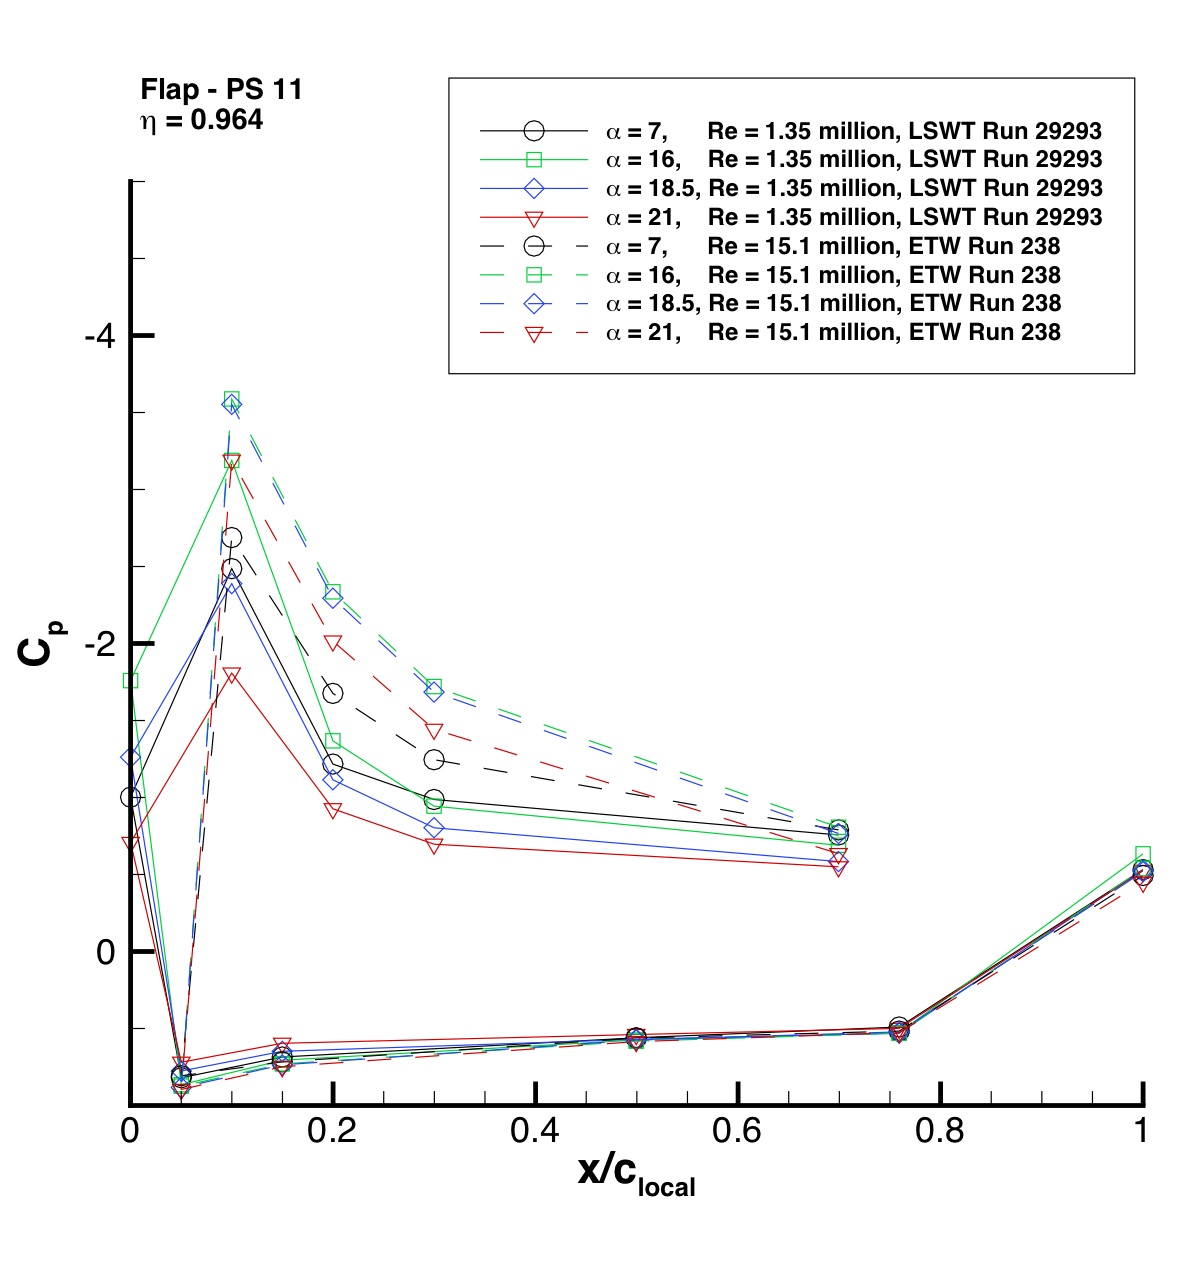
Some relevant force, moment, and pressure coefficient experimental wind tunnel data for the DLR F11 (in landing
configuration, slat 26.5 deg, flap 32 deg) are given here for two different Reynolds numbers.
Both body and wing are included in the experimental forces and moments (via an internal balance).
Experimental Data Files (data have been corrected for wall effects):
| |
Re = 1.35 million, M = 0.175 |
Re = 15.1 million, M = 0.176 |
| force/moment |
|
|
| |
|
|
| Cp, alpha=0 |
|
|
| Cp, alpha=7 |
|
|
| Cp, alpha=12 |
|
|
| Cp, alpha=16 |
|
|
| Cp, alpha=18 |
|
- - - |
| Cp, alpha=18.5 |
|
|
| Cp, alpha=19 |
|
- - - |
| Cp, alpha=20 |
|
|
| Cp, alpha = 21 |
|
|
| Cp, alpha=22.4 |
- - - |
|
Download all the force/moment and Cp data in one gzipped tar file:
DataExp_v2.tar.gz.
Note that the file cp_distr_alpha=16_RUN238_Re=15.1e6.dat was corrected for 3 typos (missing
minus signs) on 2/4/2013).
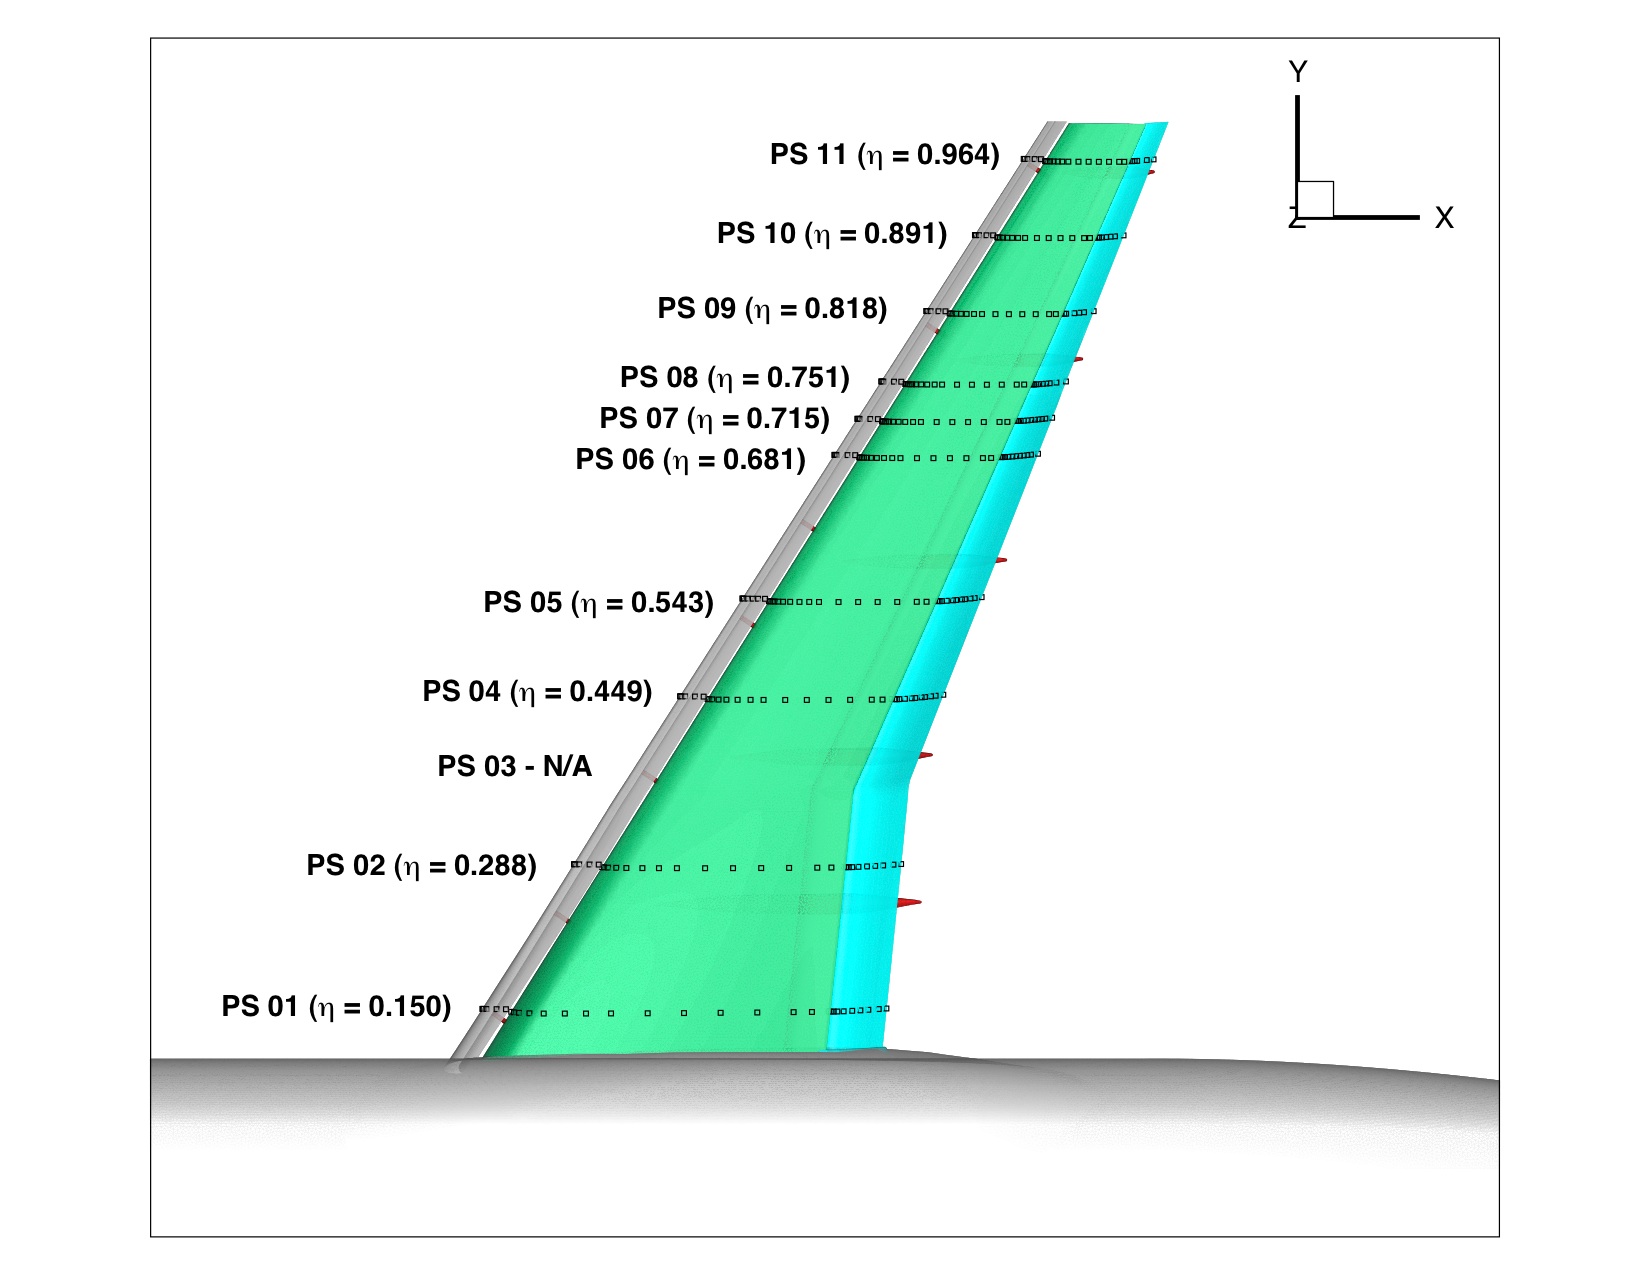
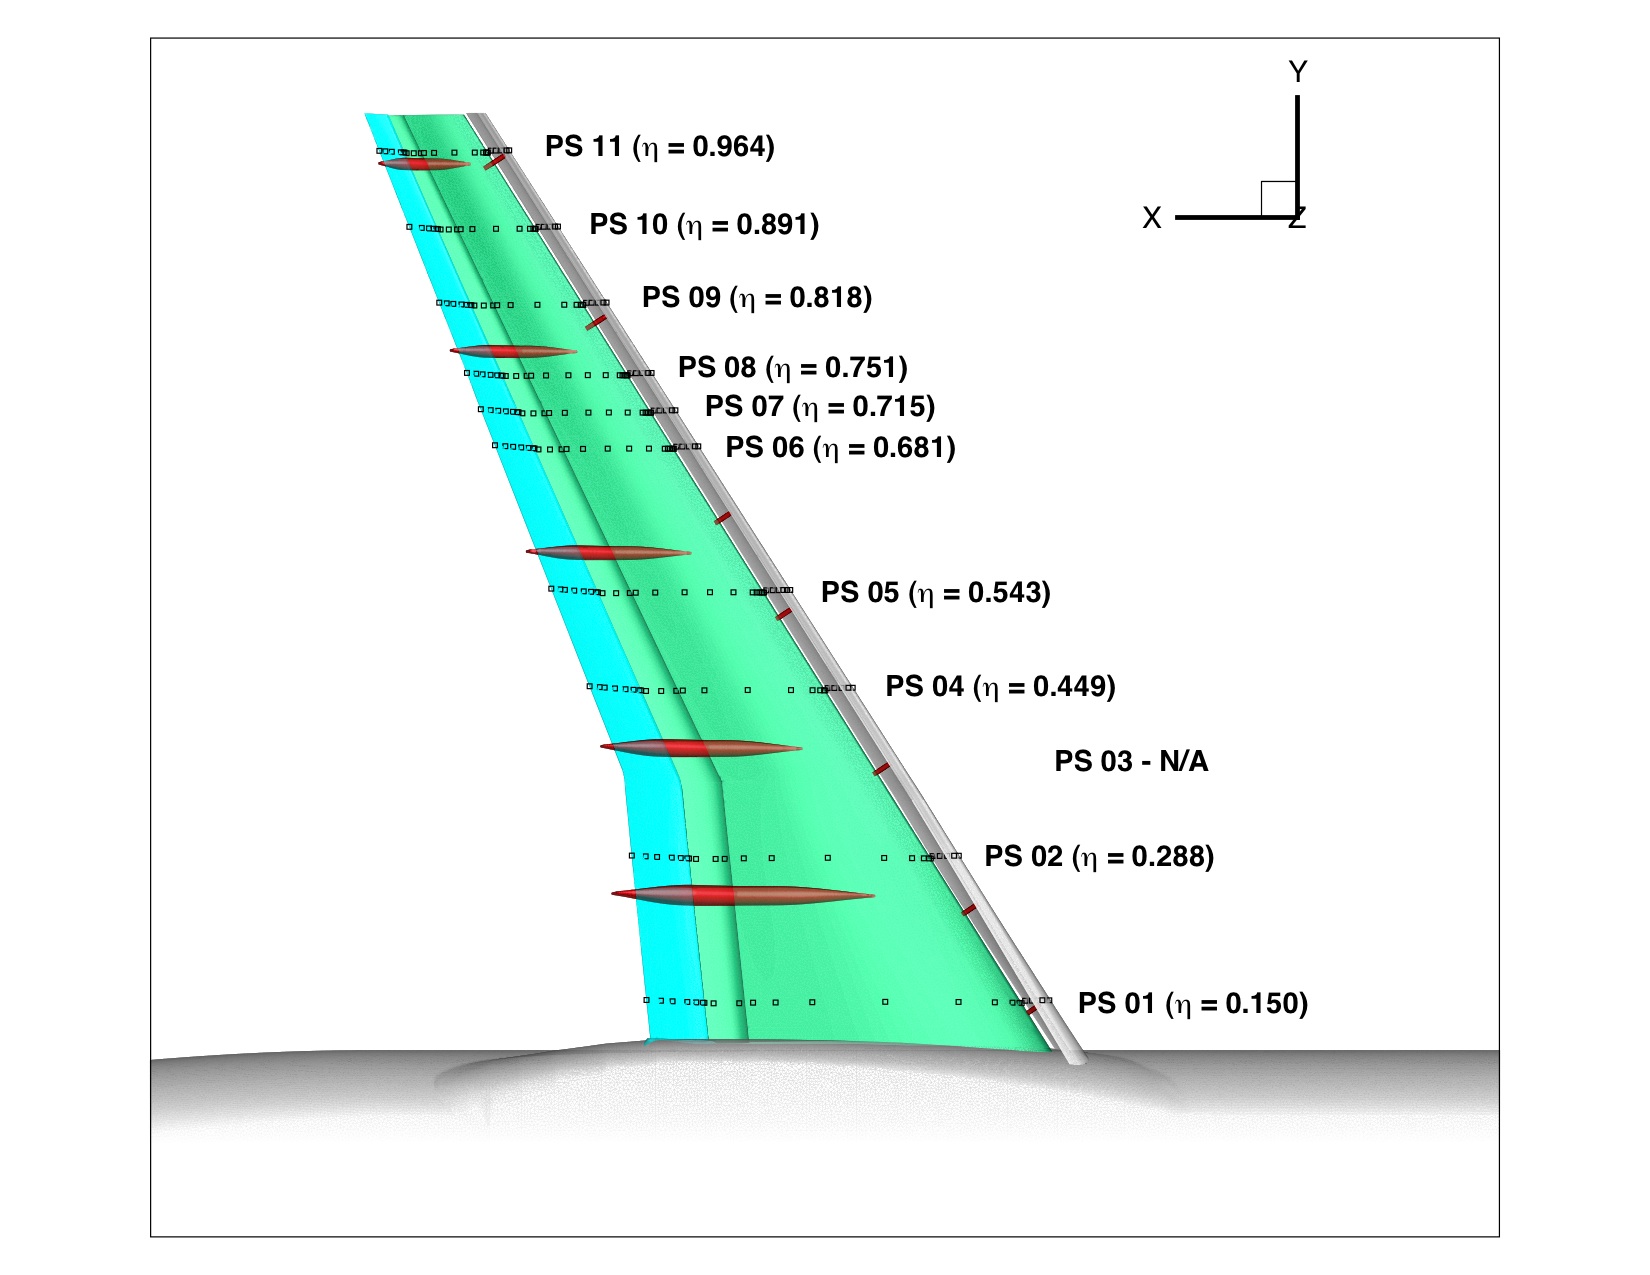
Pressure Tap Locations (upper and lower surfaces):
| Section Label |
eta, % |
Y, mm |
| PS 01 |
15.0 |
209.67 |
| PS 02 |
28.8 |
403.87 |
| PS 03 (not used) |
35.2 |
492.83 |
| PS 04 |
44.9 |
629.14 |
| PS 05 |
54.3 |
760.30 |
| PS 06 |
68.1 |
952.95 |
| PS 07 |
71.5 |
1001.28 |
| PS 08 |
75.1 |
1051.35 |
| PS 09 |
81.8 |
1145.79 |
| PS 10 |
89.1 |
1247.68 |
| PS 11 |
96.4 |
1349.83 |
In the landing configuration used for this
workshop, the above y-locations
are representative of the pressure rows on the main wing only. On the slat and flap
(which have undergone translation and rotation),
the definitions of the planes containing the pressure tap locations are given in the
following document: model-sketch-dimensions_hiliftpw2-f11.pdf
(also available on the
Geometries Page).
Some information helpful for extracting pressure coefficients appropriately from CFD datasets can be found on the
Data Submittal Forms and Postprocessing Info Page.
Sample pressure distributions (click on plot to enlarge)
Return to: Experimental Data Top Page
Return to: High Lift Prediction Workshop Home Page
Privacy Act Statement
Accessibility Statement
Responsible NASA Official:
Li Wang
Page Curator:
Li Wang
Last Updated: 02/04/2013

